Code
library(ivdtools)
library(readr)Quality control (QC) determines whether a measurement system is in control by periodically measuring quality-control materials and monitoring whether the results deviate from target values. ivdtools provides Levey–Jennings charts with Westgard multi-rule evaluation (qc_chart()), grouped monitoring in lot-change/group-change scenarios, and the Youden plot for two-level QC (youden_plot()).
This document demonstrates: obtaining and understanding the Westgard rules, whether daily QC results exceed the limits, how to evaluate grouping correctly when a reagent lot changes, and the Youden plot for two-level QC. The example data are deterministic teaching data; the Westgard rule combination and allowable limits should be pre-determined according to the laboratory’s risk-management strategy and protocol.
library(ivdtools)
library(readr)| Function | Main purpose | Key input or output |
|---|---|---|
list_westgard() |
View Westgard rule names and meanings | brief=TRUE returns only the rule vector |
qc_chart() |
Levey–Jennings chart + rule judgment | rules, mean/sd, group, run |
youden_plot() |
Youden plot for two-level QC | two sample columns, target means/SDs |
list_westgard()
Westgard QC Rules
  --------------------------------------------------
  1-2s    1 point exceeds +/-2s (warning)
  1-3s    1 point exceeds +/-3s (out of control)
  2-2s    2 consecutive points exceed +/-2s (same side)
  R-4s    2 consecutive points differ by at least 4s
  4-1s    4 consecutive points exceed +/-1s (same side)
  8x      8 consecutive points on same side of mean
  10x     10 consecutive points on same side of mean
-------------------------------------------------- qc_daily <- read_csv("./data/qc-daily.csv", show_col_types = FALSE)
qc_daily <- as.data.frame(qc_daily)
head(qc_daily)The data are daily QC results with target mean = 100, SD = 3, for a total of 30 run points.
qc <- qc_chart(
  qc_daily,
  value = "value",
  rules = "1-2s,1-3s,2-2s,R-4s,4-1s,10x",
  mean = 100,
  sd = 3,
  run = "run"
)
print(qc)
QC Control Chart
  Value column:    value
  Mean (target):   100.0000
  SD (target):     3.0000
  N (total):       30  |  Complete: 30  |  Missing: 0
  Rules applied:   1-2s, 1-3s, 2-2s, R-4s, 4-1s, 10x

  Violations:
  --------------------------------------------------
    1-2s  : points 15, 23
    1-3s  : points 15
-> 2 violation(s): 1 warning(s), 1 out of controlplot(qc)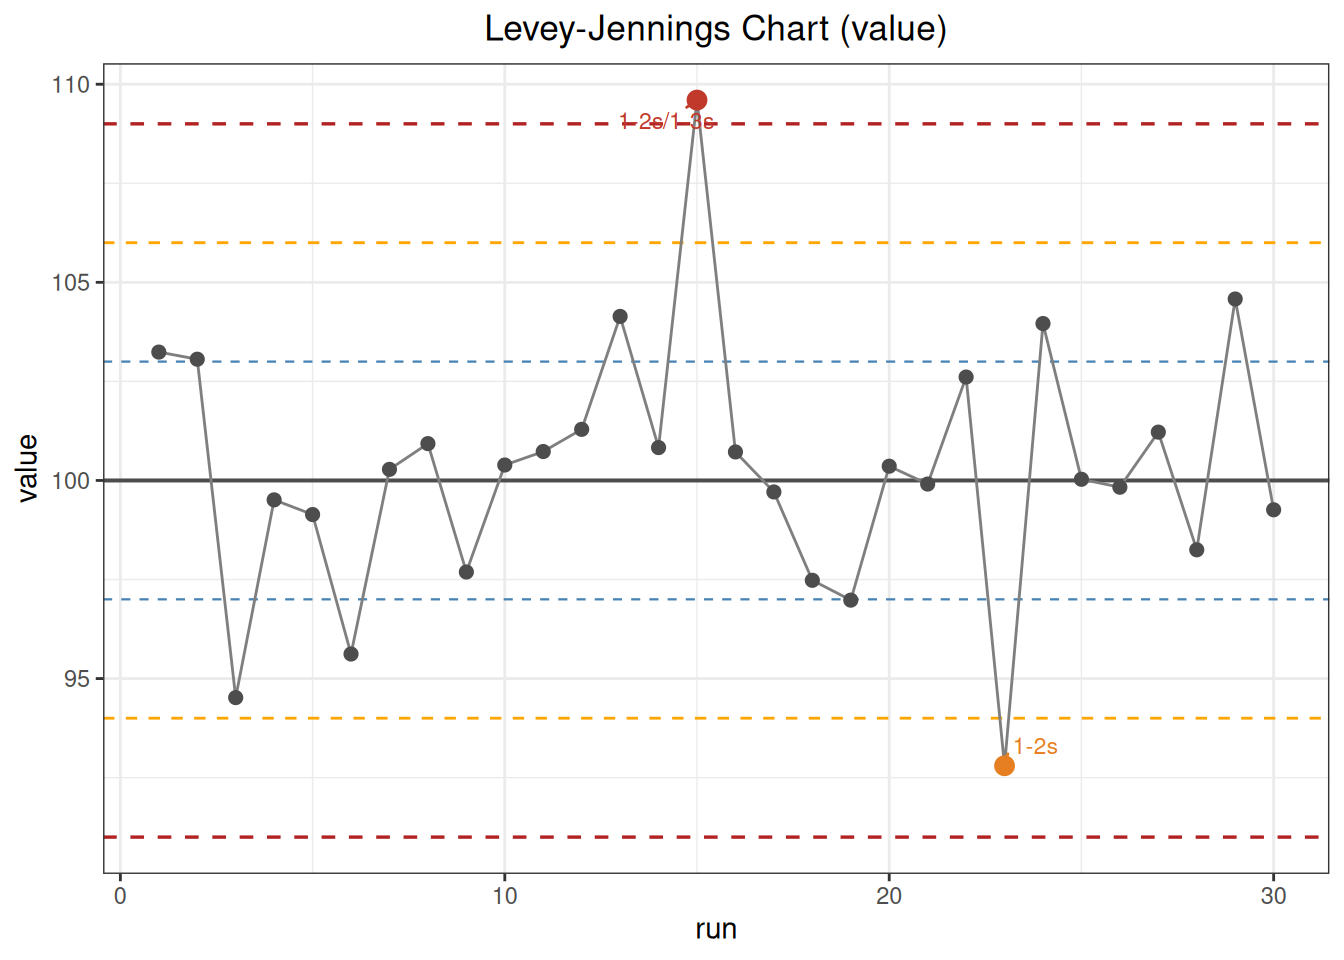
qc_chart() records the points violating each rule in $violations:
qc$violations$`1-2s`
[1] 15 23
$`1-3s`
[1] 15
$`2-2s`
integer(0)
$`R-4s`
integer(0)
$`4-1s`
integer(0)
$`10x`
integer(0)In this example, point 15 exceeds +3s (triggering 1-3s and 1-2s, judged out of control), and point 23 falls below −2s (triggering 1-2s, judged a warning). n_warn and n_oc give the warning and out-of-control point counts, respectively.
Parameter notes: The
rulesofqc_chart()is a comma-separated rule string;mean/sdare the target values (when not given, they are estimated from the data, but monitored QC should use target values from the instructions).runspecifies the run-order column, andgroupspecifies the grouping column (see Example 2).
In the data, the first 10 points are lot L1, the middle 10 are lot L2 (with an overall shift), and the last 10 are lot L3:
qc_lot <- read_csv("./data/qc-lot-change.csv", show_col_types = FALSE)
qc_lot <- as.data.frame(qc_lot)
table(qc_lot$lot)
L1 L2 L3
10 10 10 Use group = "lot" for plotting; the Westgard rules are still judged on the entire sequence:
qc_lot_all <- qc_chart(
  qc_lot,
  value = "value",
  mean = 100,
  sd = 3,
  run = "run",
  group = "lot"
)
qc_lot_all$n_oc
[1] 0plot(qc_lot_all)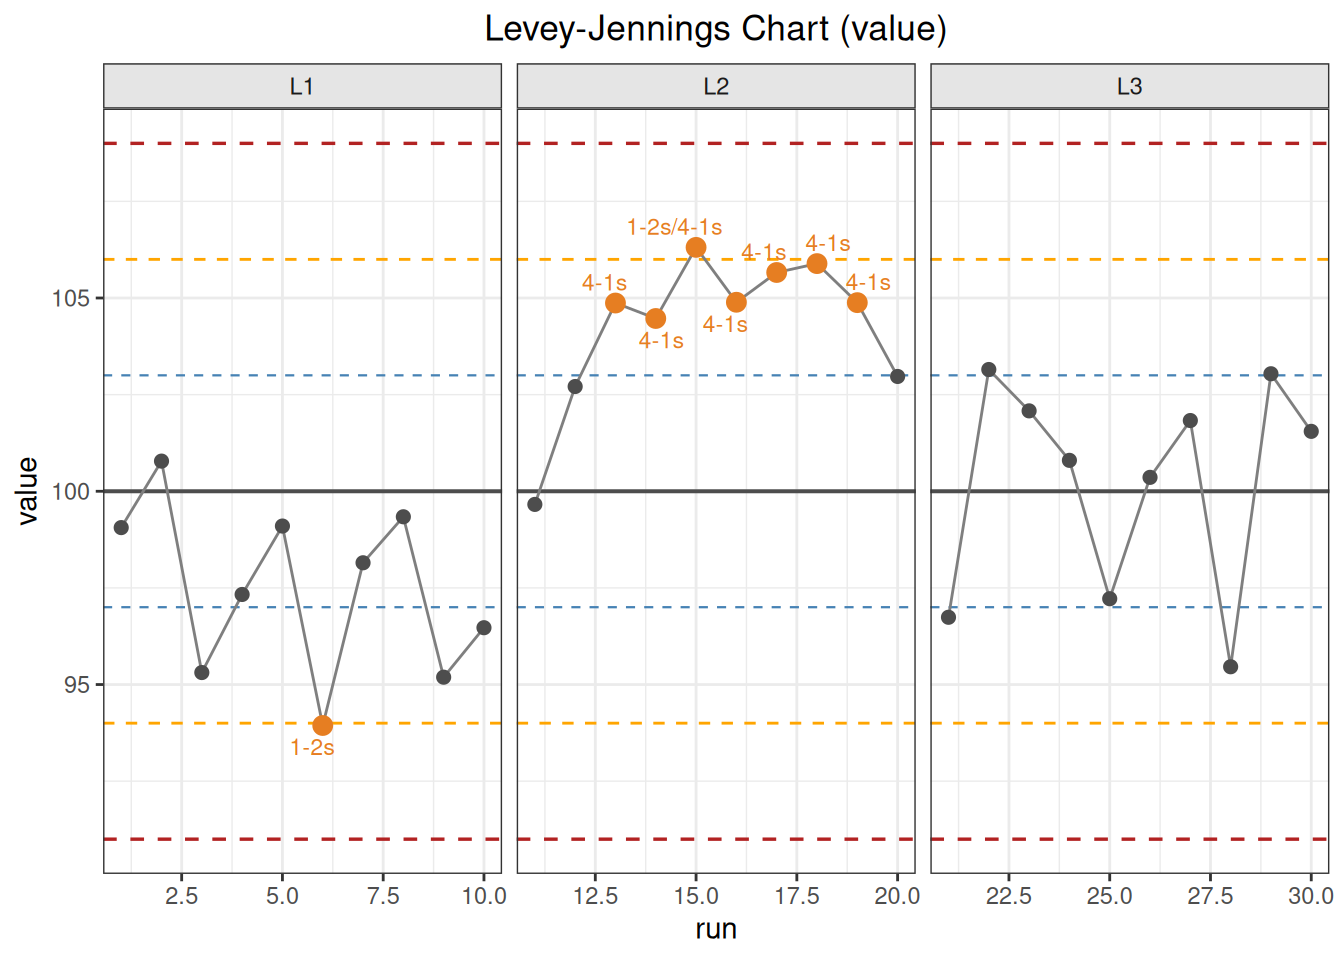
Although the plot is faceted by lot, the rules are computed on the entire sequence, so observe the systematic shift caused by the lot change.
The Youden plot uses the results of two quality-control materials at different concentrations (levels) in the same run (wide-table format, one column per level):
youden_dat <- read_csv("./data/qc-youden.csv", show_col_types = FALSE)
youden_dat <- as.data.frame(youden_dat)
head(youden_dat)yd <- youden_plot(
youden_dat,
sample1 = "low",
sample2 = "high",
mean1 = 80,
mean2 = 200,
sd1 = 2,
sd2 = 5
)
print(yd)
Youden Plot
  Sample 1 (low):
    Mean:   80.0000
    SD:     2.0000
  Sample 2 (high):
    Mean:   200.0000
    SD:     5.0000
  Correlation: 0.5428
  N (total):   30  |  Complete: 30  |  Missing: 0
Points outside +/-2SD: 3 (rows: 3, 17, 19)plot(yd)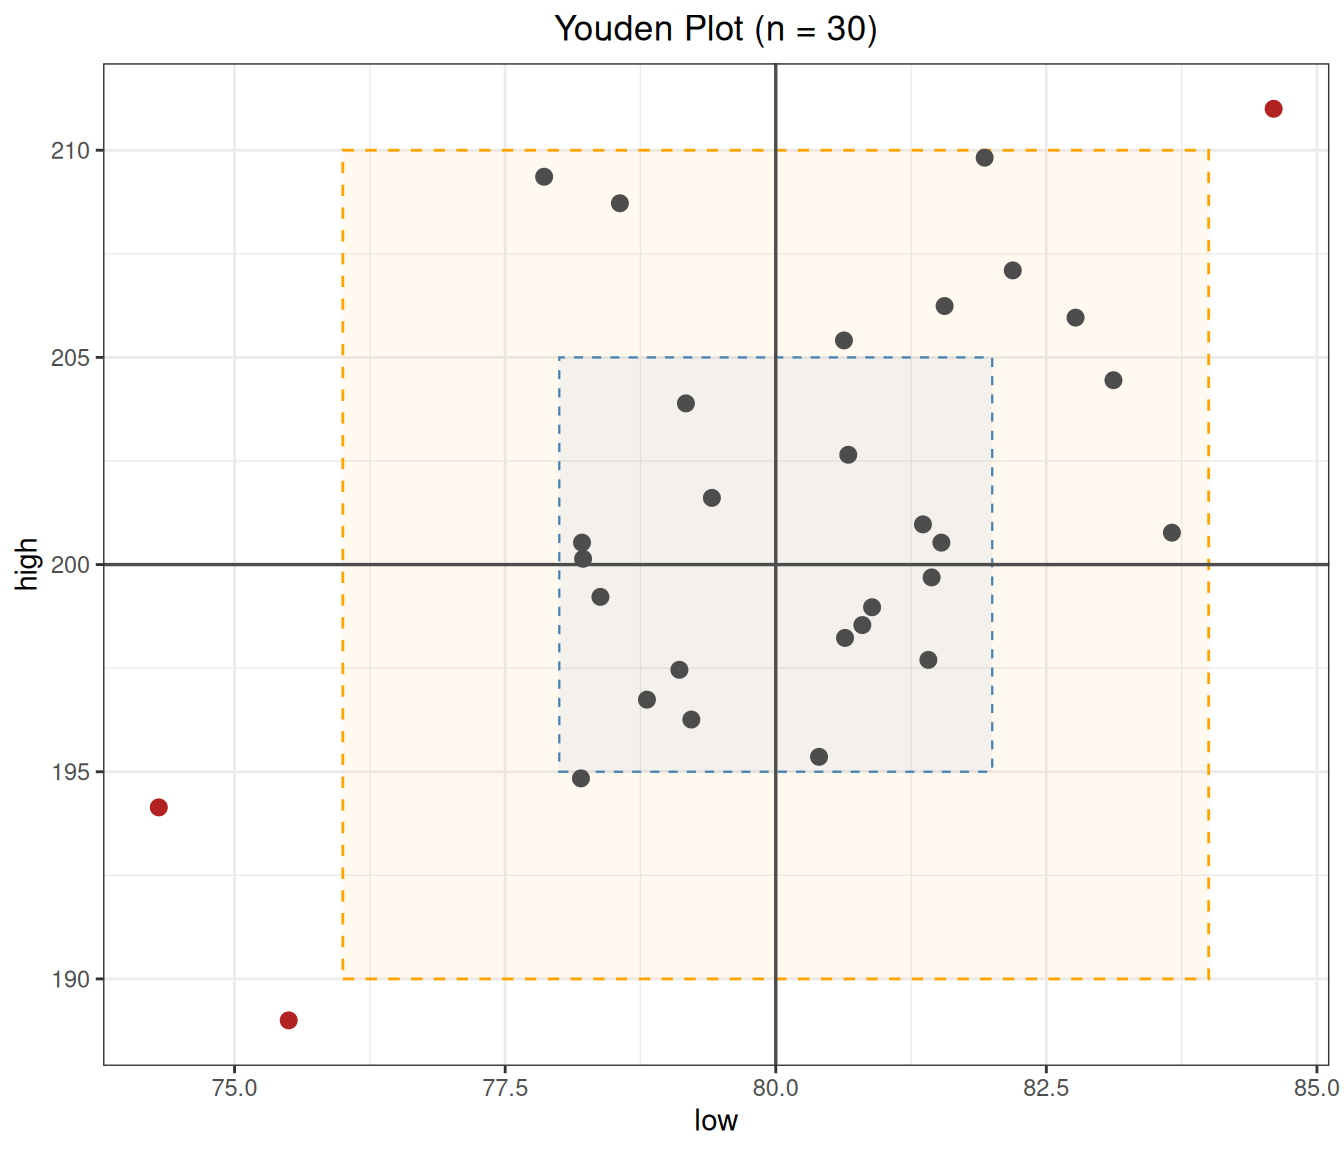
yd$outside_rows[1] 3 17 19youden_plot() uses a ±2s rectangle to mark points outside the range. In this example, 3 run points fall outside the rectangle (including an artificially set out-of-control point), suggesting that these runs may be affected by a systematic error at the same time. A shared shift at both levels (points moving outward along the diagonal) suggests a systematic error, while a large shift in a single direction is more likely to come from random error or a single-level problem.
Parameter notes: The
sample1/sample2ofyouden_plot()are the numeric columns of the two levels;mean1/mean2/sd1/sd2are the target values (when not given, they are estimated from the data).$n_outsideand$outside_rowsgive the points outside the rectangle.