Code
library(ivdtools)
library(readr)This chapter demonstrates how to use fit_equation() from ivdtools to fit calibration curves and check convergence, residuals, the effect of weights, and forward and inverse predictions. The underlying implementation calls minpack.lm, nloptr, nls2, and stats.
library(ivdtools)
library(readr)| Function | Purpose |
|---|---|
list_equation() |
View the built-in equation registry |
replicate_to_mean() |
Summarize replicate measurements and optionally calculate weights |
fit_equation() |
Fit a built-in or custom equation |
coef() |
Extract model parameters |
residuals() |
Extract observed-minus-fitted residuals |
predict() |
Predict response values forward or estimate concentrations inversely |
plot() |
Plot observed points, the fitted curve, and intervals |
compare_equation() |
Compare candidate equations |
list_equation()list_equation() ID Name Formula Params nP Engine
-----------------------------------------------------------------------
E01 Linear a + b*x a, b 2 lm
E02 Quadratic a + b*x + c*x^2 a, b, c 3 lm
E03 ExpoGrowth a * exp(b * x) a, b 2 nls
E04 ExpoDecay a * exp(-b * x) a, b 2 nls
E05 Power a * x^b a, b 2 nls
E06 Log a + b * log(x) a, b 2 lm
E07 4PLC A + (B - A) / (1 + (x / C)^D) A, B, C, D 4 nls
E08 5PLC A + (B - A) / (1 + (x / C)^D)^E A, B, C, D, E 5 nls
E09 Gaussian a * exp(-(x - b)^2 / (2 * c^2)) a, b, c 3 nls
E10 Michaelis Vmax * x / (Km + x) Vmax, Km 2 nls
E11 Sinusoidal a * sin(b * x + c) + d a, b, c, d 4 nls
E12 Cubic a + b*x + c*x^2 + d*x^3 a, b, c, d 4 lm The function returns a registry data frame containing equation IDs, names, formulas, numbers of parameters, applicable categories, and fitting engines.
replicate_to_mean()If each concentration has replicate measurements, you can fit all observations directly or first summarize them with replicate_to_mean().
replicate_to_mean(
  data, x = "Con", y = "RLU", weights = NULL, na.rm = TRUE
)
The function groups by x and returns summary fields such as the mean, number of replicates, and dispersion at each concentration. weights can provide numeric weights or a weighting rule for later fitting. na.rm = TRUE excludes missing rows; the number excluded should be recorded. Summary means are suitable for describing each level and should not automatically be treated as the error model for a future single specimen.
fit_equation()fit_equation() accepts an ordinary data.frame. x is the concentration or relative concentration and y is the instrument response; both columns must contain finite numeric values.
fit_equation() can use automatic starting values or starting values supplied through start; lower, upper, and constraints can set parameter bounds or constraints. weights accepts a numeric vector or one of the built-in schemes "equal", "1/y", "1/y^2", "1/x", and "1/x^2".
fit_equation(
  eq, data, x = "x", y = "y", start = NULL,
  lower = NULL, upper = NULL, constraints = NULL,
  weights = NULL, ...
)
The returned object has S3 class fit_equation and contains the selected equation, fitted model, parameters, data, and fitting diagnostics.
compare_equation()Main inputs
compare_equation(
  data, x = "Con", y = "RLU", eqs = c("4PLC", "5PLC")
)
The returned object has S3 class compare_equation; its $table is sorted by AIC and includes at least Eq, Name, Formula, nPar, AIC, deltaAIC, R2, and RSE. AIC is evidence for comparing candidate models, not a replacement for residuals, plateau behavior, the reporting range, or external validation. If candidate models were not prespecified in the protocol, the comparison should be labeled exploratory.
coef() and residuals()coef(fit)
residuals(fit)Here fit is the fitted object returned by fit_equation(). coef(fit) returns a named vector of fitted coefficients; residuals(fit) returns observed-minus-fitted residuals corresponding to valid observation rows.
predict()predict(
fit,
newdata,
interval = "confidence",
level = 0.95,
inverse = TRUE
)newdata contains the concentrations or responses to predict. interval and level specify the interval type and confidence level. A confidence interval describes uncertainty in the fitted mean; a prediction interval also includes single-observation error and is usually wider. inverse requests inverse estimation of concentration from response.
The function returns a data frame containing input values, point predictions, and the requested lower and upper bounds. For inverse prediction, the point prediction is the estimated concentration.
Avoid extrapolating beyond the calibration concentration range. Inverse prediction is highly sensitive to response error on a plateau, and non-monotonic models may have multiple solutions.
plot()plot(fit, interval = "confidence", level = 0.95)Use the figure to check observed points, the fitted curve, intervals, and the calibration range. A formal report should preserve the equation, weights, interval type, parameters, convergence status, and plotting parameters.
The linear equation is appropriate when the response changes with concentration at an approximately constant rate across the working range. In the ivdtools registry it corresponds to E01:
\[y = a + b x\]
Here \(a\) is the intercept and \(b\) is the slope. This example uses deterministic teaching data in data/003-校准曲线拟合/Linear.csv only to demonstrate the workflow. A formal calibration should define the concentration range, number of replicates, weights, and acceptance criteria in the study protocol.
# Read the linear data file
fit_linear_data <- read_csv(
  "./data/003-校准曲线拟合/Linear.csv",
  show_col_types = FALSE
)

# Inspect the data structure
head(fit_linear_data, 6)
# A tibble: 6 × 3
Sample Con RLU
<chr> <dbl> <dbl>
1 c1 0 1185
2 c2 5 3415
3 c3 10 5230
4 c4 20 9810
5 c5 40 18080
6 c6 60 26290# Fit the linear calibration curve
fit_linear <- fit_equation(
"E01",
data = fit_linear_data,
x = "Con",
y = "RLU"
)
# Display fitting results and parameters
print(fit_linear)E01 (Linear)
Formula: a + b*x
Call:
stats::lm(formula = frm, data = d, weights = weights)
Residuals:
Min 1Q Median 3Q Max
-736.970 -185.656 -38.780 151.657 693.530
Coefficients:
Estimate Std. Error t value Pr(>|t|)
a 1292.468 183.32973 7.04996 3.4988e-05 ***
b 418.525 1.87989 222.63236 < 2.22e-16 ***
---
Signif. codes: 0 '***' 0.001 '**' 0.01 '*' 0.05 '.' 0.1 ' ' 1
Residual standard error: 395.923 on 10 degrees of freedom
Multiple R-squared: 0.9998, Adjusted R-squared: 0.9998
F-statistic: 49565.2 on 1 and 10 DF, p-value: <2e-16coef(fit_linear) a b
1292.468 418.525 # Plot observations, fitted line, and a 99% confidence interval for the mean
plot(fit_linear, interval = "confidence", level = 0.99)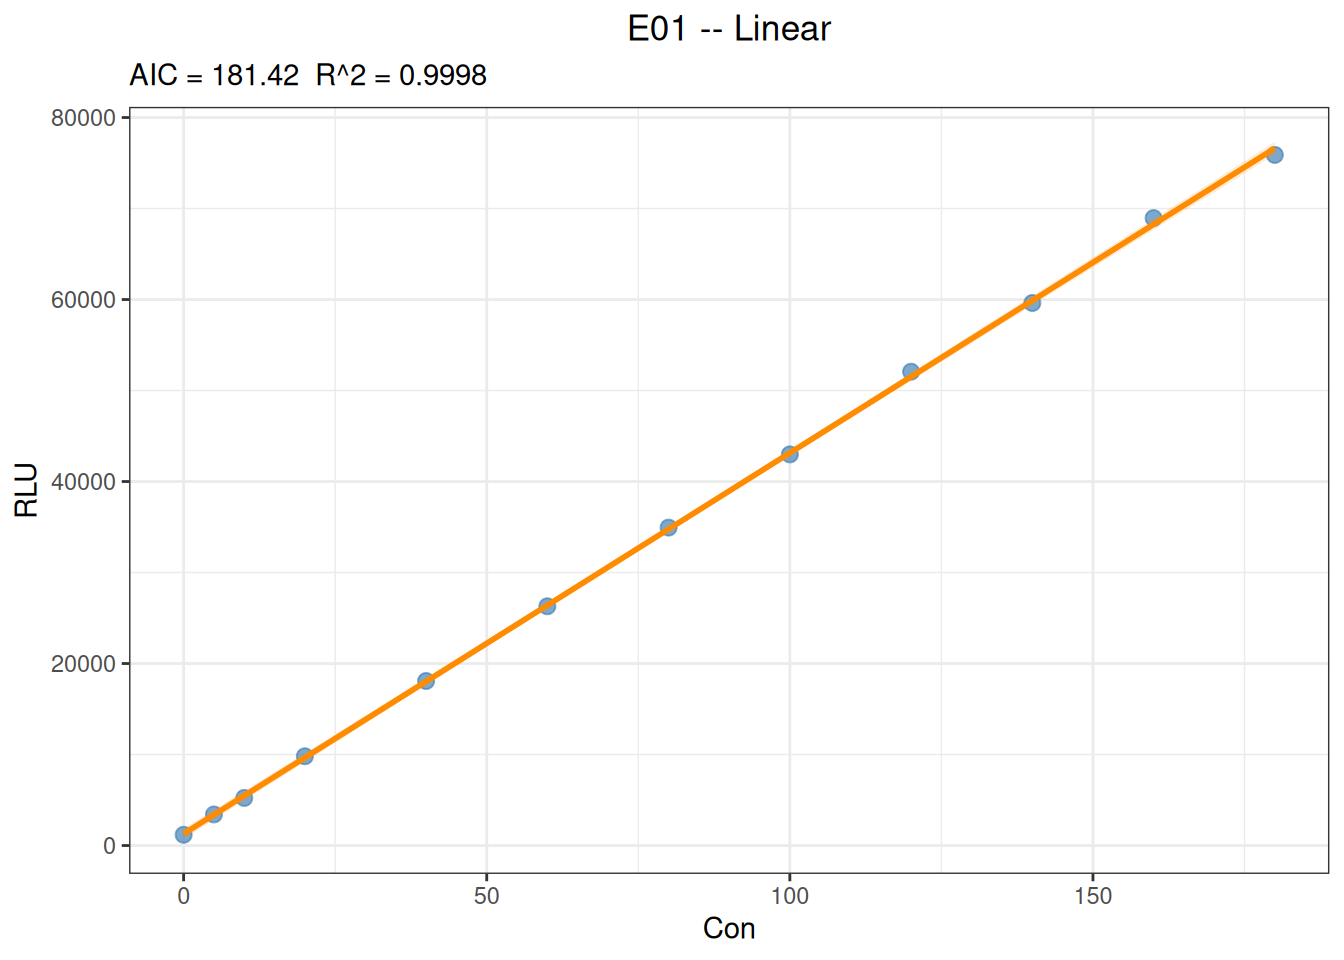
# Predict response from concentration
predict(
  fit_linear,
  newdata = data.frame(Con = c(25, 75, 150)),
  interval = "confidence",
  level = 0.95
)
x y y_ci_lwr y_ci_upr
25 11755.59 11422.52 12088.66
75 32681.84 32427.13 32936.56
150 64071.22 63670.87 64471.57# Estimate concentration inversely from response
predict(
fit_linear,
newdata = data.frame(RLU = c(10000, 30000, 60000)),
inverse = TRUE
) x y
20.80529 10000
68.59215 30000
140.27246 60000The slope represents the average rate at which response changes with concentration, and the intercept is the estimated response at concentration 0. Assess model suitability using residual trends, fitted intervals, back-calculated bias, and prespecified acceptance criteria; a high \(R^2\) alone does not establish complete linearity across the calibration range. Inverse predictions should be restricted to the actual calibration range and should not be extrapolated without justification.
The four-parameter logistic (4PLC) model is nonlinear:
\[y = A + \frac{B-A}{1 + (x/C)^D}\]
Here \(A\) and \(B\) are the two asymptotic plateaus, \(C\) is the concentration scale at the midpoint of the curve, and \(D\) controls the direction and steepness. Interpret the parameters in light of the actual signal direction.
# Read the data file
fit_4plc_data <- read_csv("./data/003-校准曲线拟合/4PLC.csv", show_col_types = FALSE)

# Inspect the data structure
head(fit_4plc_data, 6)
# A tibble: 6 × 3
Sample Con RLU
<chr> <dbl> <dbl>
1 c1 0 5637
2 c2 0.05 16014
3 c3 0.2 47520
4 c4 0.51 125038
5 c5 1.03 277621
6 c6 5.19 1498023# Fit the 4PLC curve with 1/y^2 weights
fit_4plc <- fit_equation(
"4PLC",
data = fit_4plc_data,
x = "Con",
y = "RLU",
weights = "1/y^2"
)
# Display the fitting results
print(fit_4plc)E07 (4PLC)
Formula: A + (B - A) / (1 + (x / C)^D)
Call:
fit_equation(eq = "4PLC", data = fit_4plc_data, x = "Con", y = "RLU",
weights = "1/y^2")
Residuals:
Min 1Q Median 3Q Max
-1038926.254 -2031.562 491.283 35707.649 809345.965
Coefficients:
Estimate Std. Error t value Pr(>|t|)
A 5.66828e+03 2.30614e+02 24.57907 4.7016e-08 ***
B 2.00185e+08 6.72603e+07 2.97627 0.020624 *
C 4.83741e+02 1.74222e+02 2.77658 0.027433 *
D -1.08082e+00 1.02400e-02 -105.54858 1.8062e-12 ***
---
Signif. codes: 0 '***' 0.001 '**' 0.01 '*' 0.05 '.' 0.1 ' ' 1
Residual standard error: 0.042025 on 7 degrees of freedom
AIC: 265.29 Iterations: 7# Obtain fitted residuals
residuals(fit_4plc) [1] -3.128012e+01 4.912832e+02 -2.231827e+03 -1.831297e+03 1.304427e+04
[6] 1.466392e+04 5.675138e+04 -3.256634e+05 6.828909e+05 -1.038926e+06
[11] 8.093460e+05# Plot the curve
plot(fit_4plc, interval = "prediction", level = 0.95)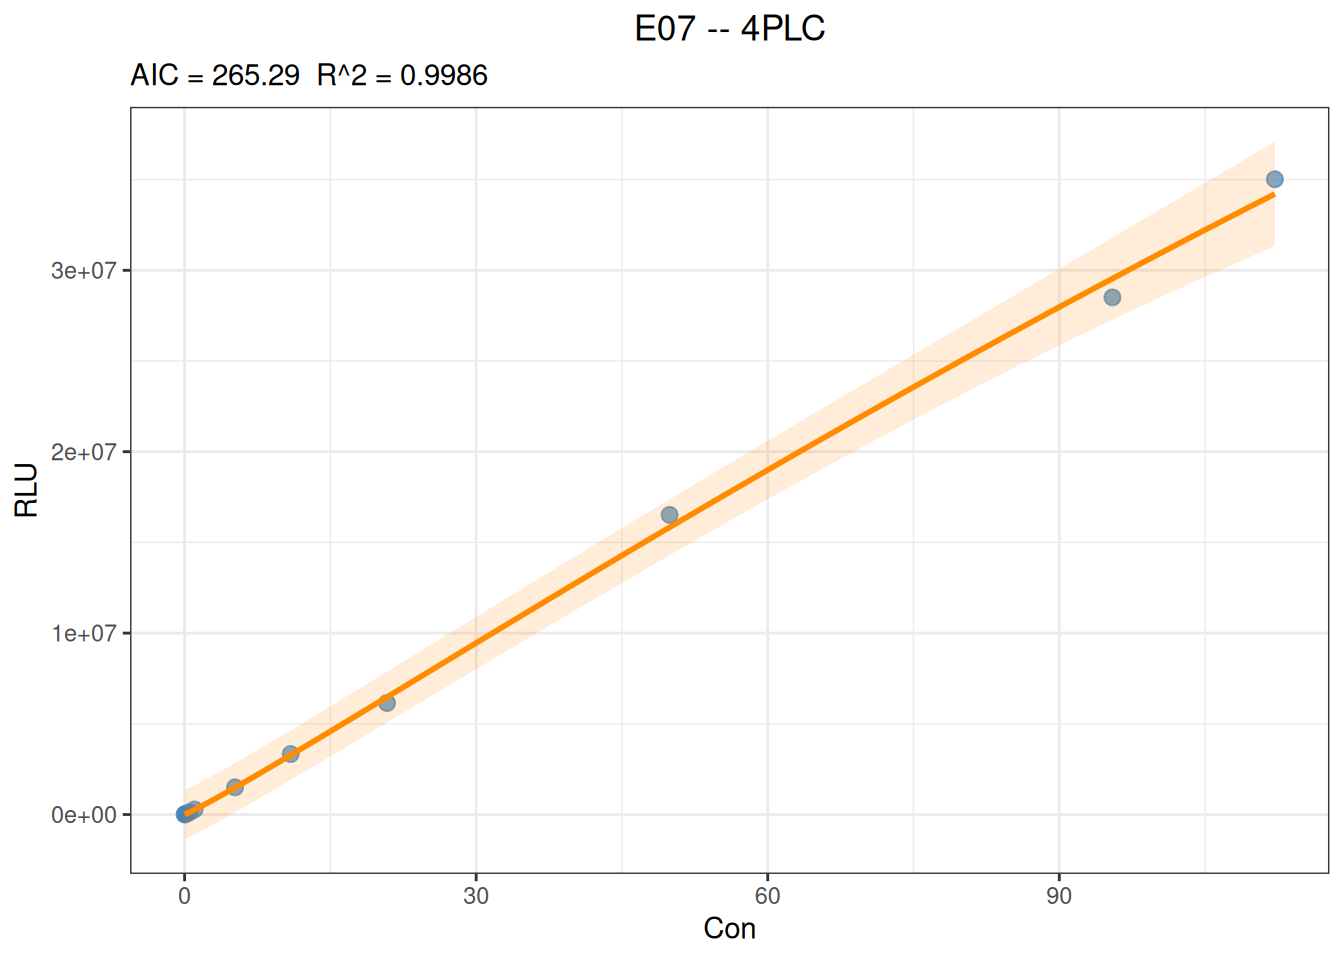
# Predict y from x
predict(
  fit_4plc,
  newdata = data.frame(Con = c(20, 200, 1000)),
)
x y
20 6205093
200 55646993
1000 137475699# Predict x from y
predict(
fit_4plc,
newdata = data.frame(RLU = c(10000, 100000, 1000000)),
inverse = TRUE
) x y
0.023371 1e+04
0.404396 1e+05
3.589256 1e+06The following example reuses the linear data above and focuses on how to specify parameter constraints in fit_equation().
When theory says that the response should be 0 at concentration 0, or when the protocol explicitly requires that the intercept not be estimated, the intercept parameter \(a\) can be fixed at 0:
fit_linear_zero <- fit_equation(
  "E01",
  data = fit_linear_data,
  x = "Con",
  y = "RLU",
  constraints = list(eq = function(p) p["a"])
)

print(fit_linear_zero)
E01 (Linear)
Formula: a + b*x
Call:
fit_equation(eq = "E01", data = fit_linear_data, x = "Con", y = "RLU",
constraints = list(eq = function(p) p["a"]))
Residuals:
Min 1Q Median 3Q Max
-1309.733 268.826 616.260 1002.094 1270.563
Coefficients:
Estimate Std. Error t value Pr(>|t|)
a 0.000000 447.987279 0.000 1
b 428.887404 4.594117 93.356 9.41e-15 ***
---
Signif. codes: 0 '***' 0.001 '**' 0.01 '*' 0.05 '.' 0.1 ' ' 1
Residual standard error: 1019.73 on 9 degrees of freedom
AIC: 166.80, R^2: 0.9988
Convergence: 4 (NLOPT_XTOL_REACHED: Optimization stopped because xtol_rel or xtol_abs (above) was reached.)